
by rodaniel | Mar 25, 2024 | Blog, teacher leadership
Imagine a classroom where students know exactly what’s expected of them, where grades are clear and consistent, and where learning feels focused and achievable. This is the power of rubrics in action. Rubrics, those handy scoring guides that break down...

by Jenni Aberli | Mar 19, 2024 | Blog
Teachers always tell us how much they love the strategies component of ALM and how using the strategies are an effective way to engage students with the content in their classrooms. Of course, we love hearing this. Engagement is important to learning. If students...

by vmillerbennett | Feb 28, 2024 | Blog
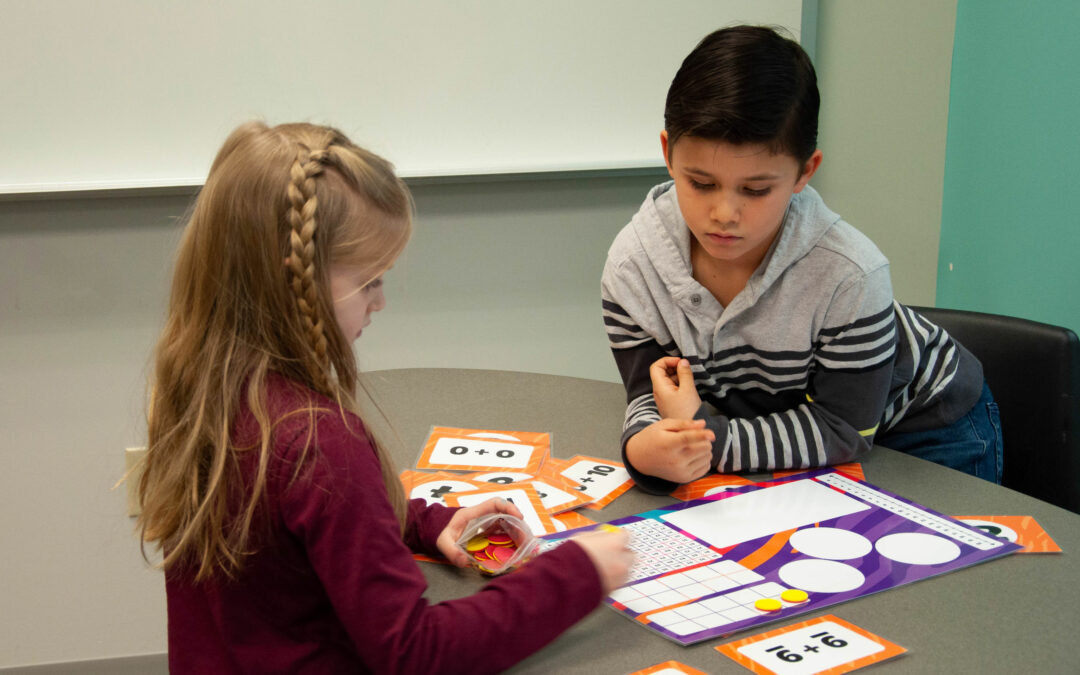
A search on the internet for “CUBES math strategy” yields about 36 million results. Seeing a bright, cheery, and colorful CUBES poster on display in mathematics classrooms is a typical occurrence. Elementary and middle school mathematics teachers who are familiar with...
by rodaniel | Feb 23, 2024 | Uncategorized
Background Time management is the process of organizing and planning how to divide your time between specific activities. It is believed that good time management enables you to work more efficiently so that you get more done in less time. Additionally time management...

by aperkins | Feb 13, 2024 | Uncategorized
I recently interviewed Dr. David Paige, a professor of Literacy and Director of the Jerry L. Johns Literacy Clinic at Northern Illinois University. His work and research are widely recognized, as evidenced by his publications in numerous academic journals in the field...
by jwright | Feb 1, 2024 | Blog
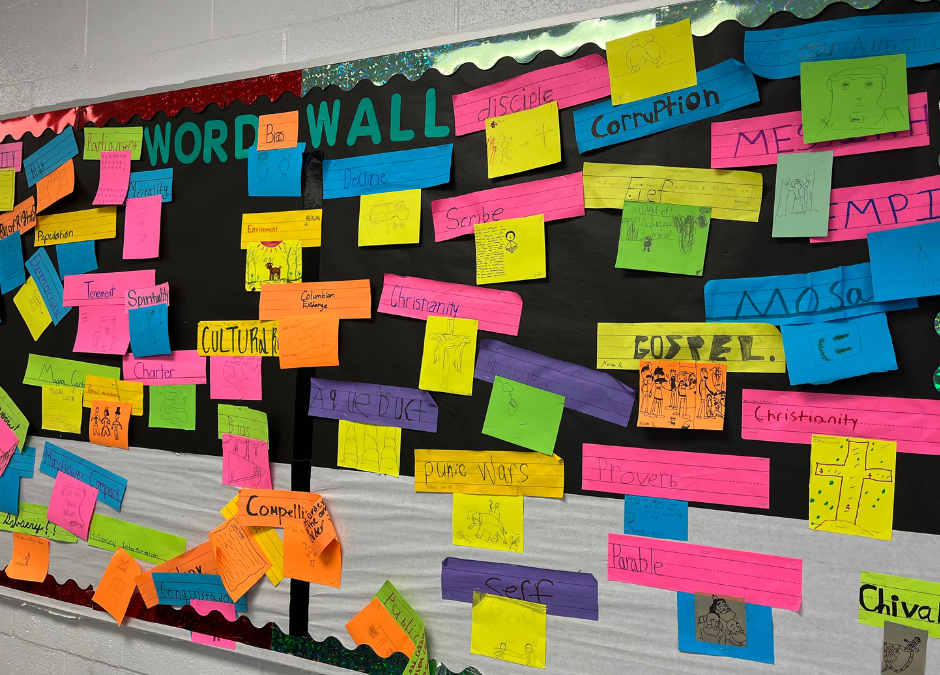
Vocabulary Development is a crucial aspect of a student’s academic journey, especially in middle and high school. A robust vocabulary not only enhances students’ communication skills but also serves as a gateway to deeper understanding and critical...
by Jenni Aberli | Jan 16, 2024 | Blog
As the number of multilingual learners (MLs) in classrooms continues to increase, teachers in all disciplines must be prepared to meet their needs as part of regular, core instruction. Federal law dictates that MLs have equitable access to grade-level standards, and...
by rodaniel | Dec 7, 2023 | Blog, mathematics
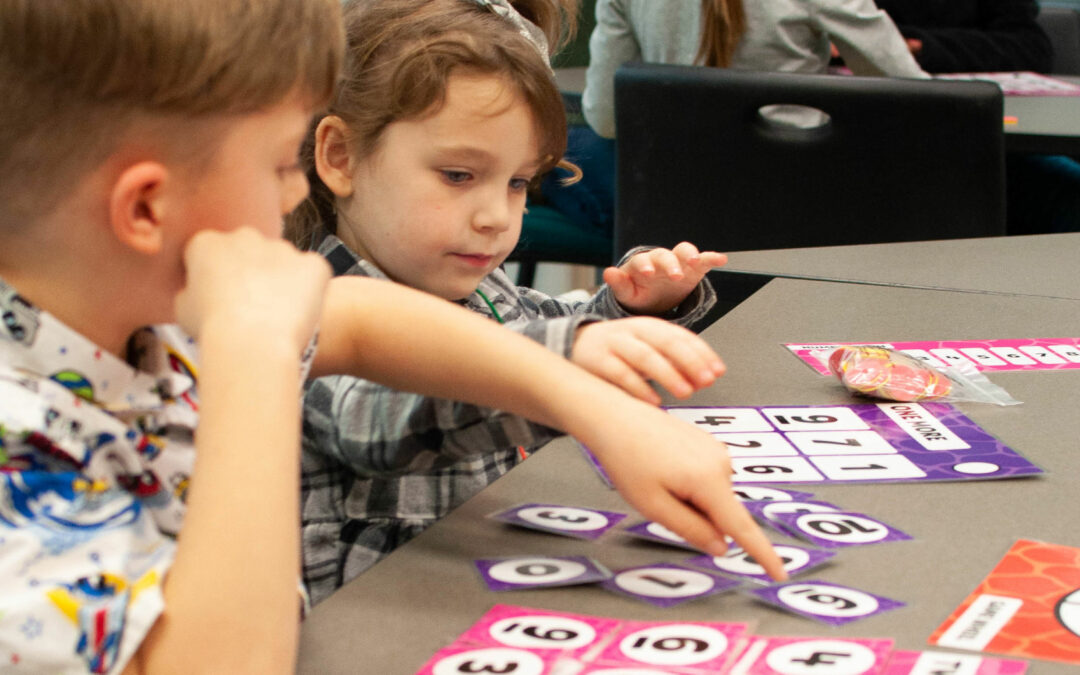
Procedural fluency is the ability to perform mathematical procedures accurately, efficiently, and flexibly (NCTM, 2023). It is a fundamental skill that is essential for success in mathematics. Students who are procedurally fluent are able to solve problems quickly and...
by vmillerbennett | Nov 27, 2023 | Blog
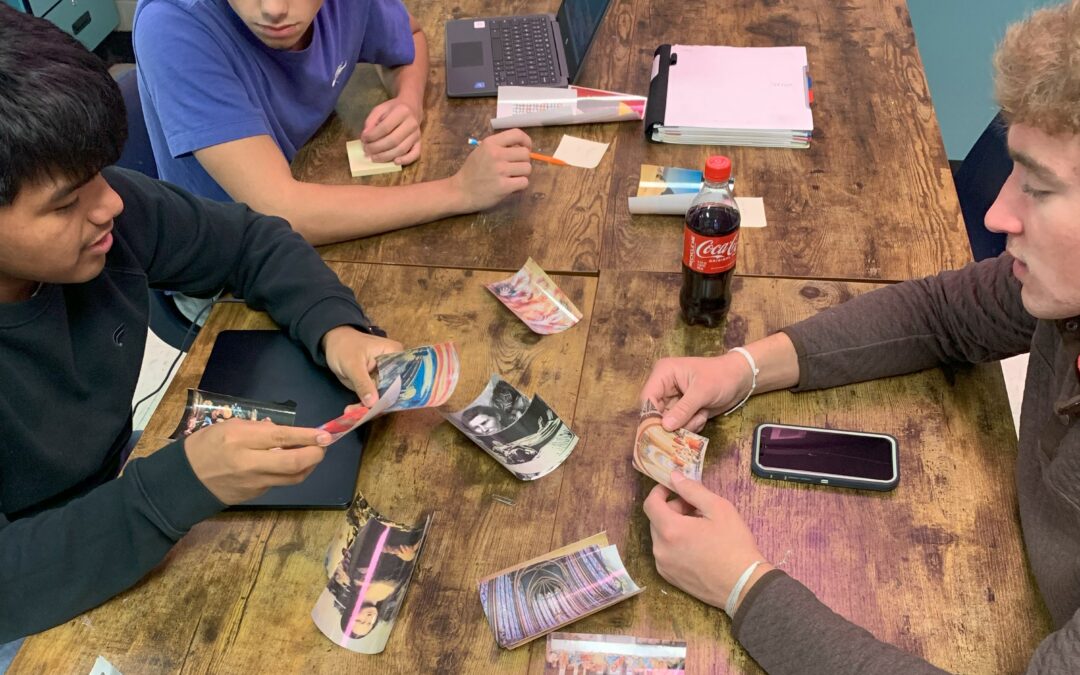
Recently, I was working alongside one of my colleagues and we were presenting at a professional learning event designed for High School mathematics teachers. Though our focus was not necessarily mathematics vocabulary, one of the teachers shared that she expected...

by aperkins | Nov 7, 2023 | Blog
How is your school district currently fostering parent and family engagement at the preschool level? The Collaborative for Teaching and Learning (CTL) is positioned to support your district with professional development regarding parent and family engagement...
