Recommendation 5 – Using Visual Representations of Mathematical Ideas
Connected to the CCSSO Standards and Instructional Recommendations
This is the third in a series of five postings that connect the Institute of Education Sciences (IES) practice guide recommendations, Assisting Students Struggling with Mathematics: Response to Intervention (RTI) for Elementary and Middle School Students with corresponding CCSSO Standards indicators, and an instructional look alike for that recommendation.
The IES guide identifies eight recommendations that are designed to help teachers, principals, and administrators use Response to Intervention for early detection, prevention, and support of students struggling with mathematics. This guide is a synthesis of research that provides instructional recommendations in support of engaging those struggling mathematics students. See IES Practice Guides.
RTI Recommendation 5: Intervention materials should include opportunities for students to use visual representations of mathematical ideas.
CCSSO Standards:
- Solve word problems by using objects, drawings, and equations with a symbol for the unknown number to represent the problem.
- Represent and solve problems involving addition, subtraction, multiplication, and division.
- Explain correspondences between equations, verbal descriptions, tables, graphs, or draws diagrams.
- Make models where technology can enable the visualizing of results of varying assumptions.
- Show measurements by making line plots.
- Draw a scale picture graph and bar graph to represent a data set.
- Describe, analyze, compare, and classify shapes through building, drawing, and analyzing those shapes.
- Represent and analyze quantitative relationships between dependent and independent variables.
- Draw, construct, and describe geometrical figures and describe the relationships between them.
- Represent complex numbers and their operations on the complex plane.
What would using visual representations of mathematical ideas look like instructionally?
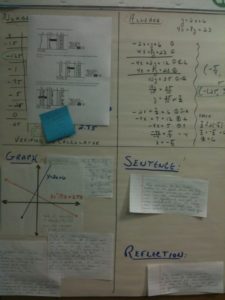
- For finding solutions to an algebraic equation, a visual example would be through the use of multiple representations using a table/chart showing the input and output values, the algebraic solution using properties of Real Numbers, the graphic solution, and expressing the meaning of the solution in words.
Drawing a model or using algebra tiles is also recommended as an aid for bridging the concrete to the abstract gap for using variables, solving equations, and simplifying expressions. These connected visual representations provide numerous schema upon which students can rely for assistance. This supports the research findings that, “A major goal of interventions should be to systematically teach students how to develop visual representations and how to transition these representations to standard symbolic representations.”
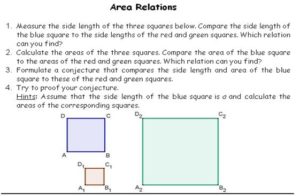
- Geogebra provides a free website for K – 12+ students and educators where they can interact with the graphic, algebra, and spreadsheets, http://www.geogebra.org/cms/ A sample screen from Geogebra illustrates the versatility and usefulness in creating visual representations for understanding geometric relationships.
- Other examples from the IES guide of providing visual representations for student learning include:
In Example 6, the use of bars for computation reminds me of the bar model prevalent in the Singapore Mathematics Series.
See other blog entries for discussion of the critical aspects for developing number sense using the number line visual. All mathematics classrooms should have number lines displayed with student interaction at all times.


